


Pepe Coin price has dived and is not finding bids. It has dropped for five straight weeks and erased over 65% of value during this time. On the positive side, the Livermore Speculative Chart points to a potential rebound in the next few weeks. A surge to its its all-time high would mean a 190% increase from the current level. However, narrowing the chart further shows that the bullish view has a catch.
Pepe Coin Price is Bullish: Livermore Speculative Chart
Pepe coin, the third-biggest meme coin in the crypto industry, slumped from an all-time high of $0.00002830 in December to a low of $0.0000080.
The coin has a key catalyst that may push it much higher in the coming weeks. Daze, a popular crypto analyst pointed to the Livermore Speculative Chart (LSC), which may see it rebounding since it has hit a crucial support level.
The LSC is a chart structure based on Jesse Livermore, one of the top legendary traders of all time. It is based on the concept of a rising broadening wedge chart pattern, which is usually a bearish sign. As shown below, one counts the higher highs and higher lows up to number 7. After that, the coin stages a strong bullish breakout for a while, then drops.

Daze believes that the Pepe coin price has now moved to the seventh phase, which will lead to a strong rebound. A crucial caveat of this view is that such a rebound may take time since it is based on the weekly chart. Chart formations on the weekly tend to take weeks or even months to complete.

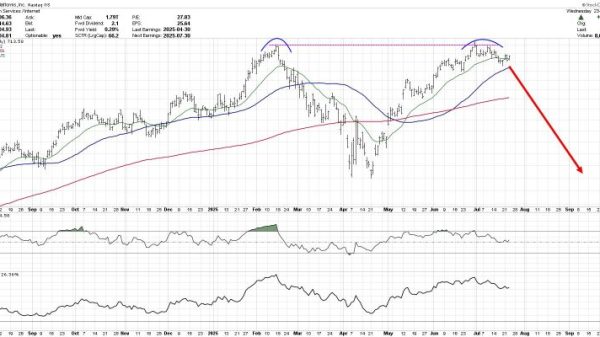
Pepe Price Daily Chart Calls For Caution
The longer-term Pepe coin price chart has a bullish catalyst in the form of the Livermore formation. However, the meme coin may have some volatility in the short term since three important things have happened recently.
First, the coin has formed a head and shoulders pattern, a popular bearish reversal sign, which explains why it has plunged recently.
Second, Pepe has formed a death cross pattern, a popular risky pattern that forms when the 50-day and 200-day moving averages cross each other. In this case, the two weighted MAs have made a crossover. Weighted moving averages are usually more sensitive than the others because they rely on recent data.
Third, the value of Pepe has dropped below the 61.8% Fibonacci Retracement level, where most rebounds happen. Therefore, there is a risk that the coin may have some volatility in the short term.

More downside may see it drop to the key support at $0.000006730, the 78.6% retracement level. A rebound, on the other hand, could lead to more upside to the 38.2% retracement at $0.00001784.
The post Pepe Coin Price Chart Points to a 190% Surge, But There’s a Catch appeared first on CoinGape.