


S&P 500 earnings are in for 2024 Q4, and here is our valuation analysis.
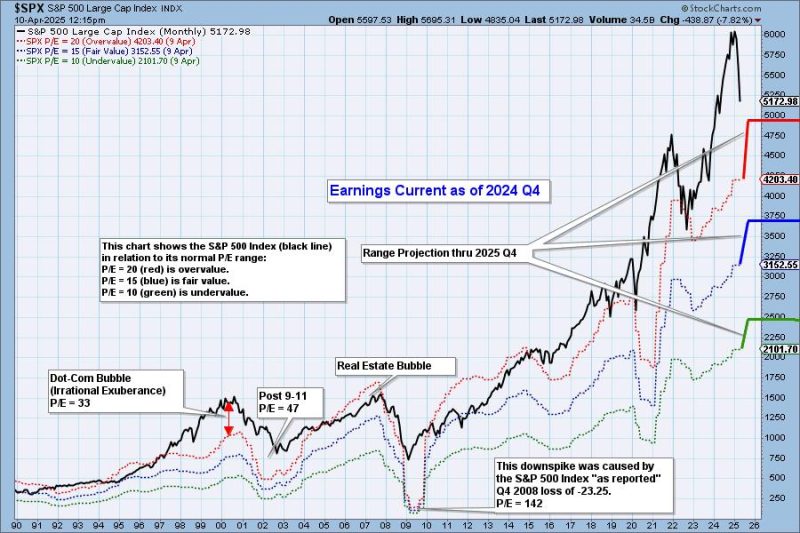
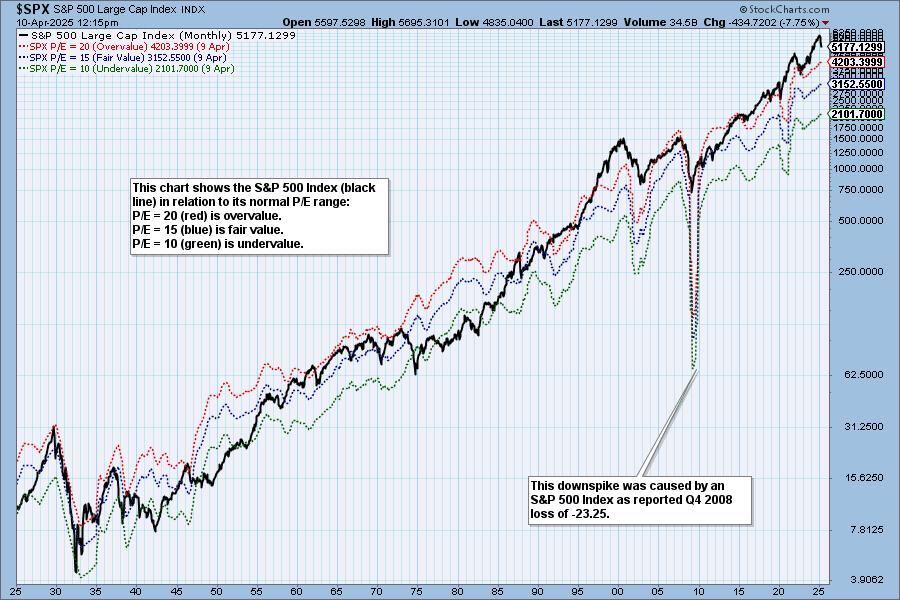
The following chart shows the normal value range of the S&P 500 index ($SPX), indicating where the S&P 500 would have to be to have an overvalued P/E of 20 (red line), a fairly valued P/E of 15 (blue line), or an undervalued P/E of 10 (green line). Annotations on the right side of the chart show where the range is projected to be based on earnings estimates through 2025 Q4.

Historically, price has usually remained below the top of the normal value range (red line); however, since about 1998, it has not been uncommon for price to exceed normal overvalued levels, sometimes by a lot. The market has been mostly overvalued since 1992, and it has not been undervalued since 1984. We could say that this is the “new normal,” except that it isn’t normal by GAAP (Generally Accepted Accounting Principles) standards.
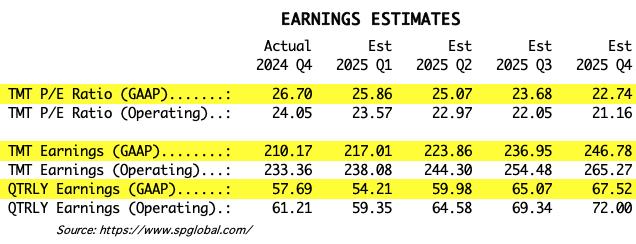
We use GAAP earnings as the basis for our analysis. The table below shows earnings projections through December 2025. Keep in mind that the P/E estimates are calculated based upon the S&P 500 close as of March 31, 2025. They will change daily depending on where the market goes from here. It is notable that the P/E remains outside the normal range.
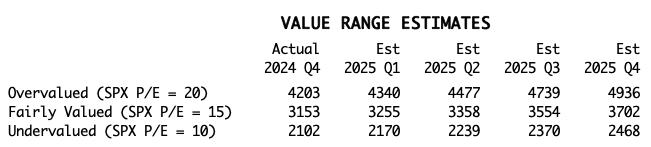
The following table shows where the bands are projected be, based upon earnings estimates through 2025 Q4.
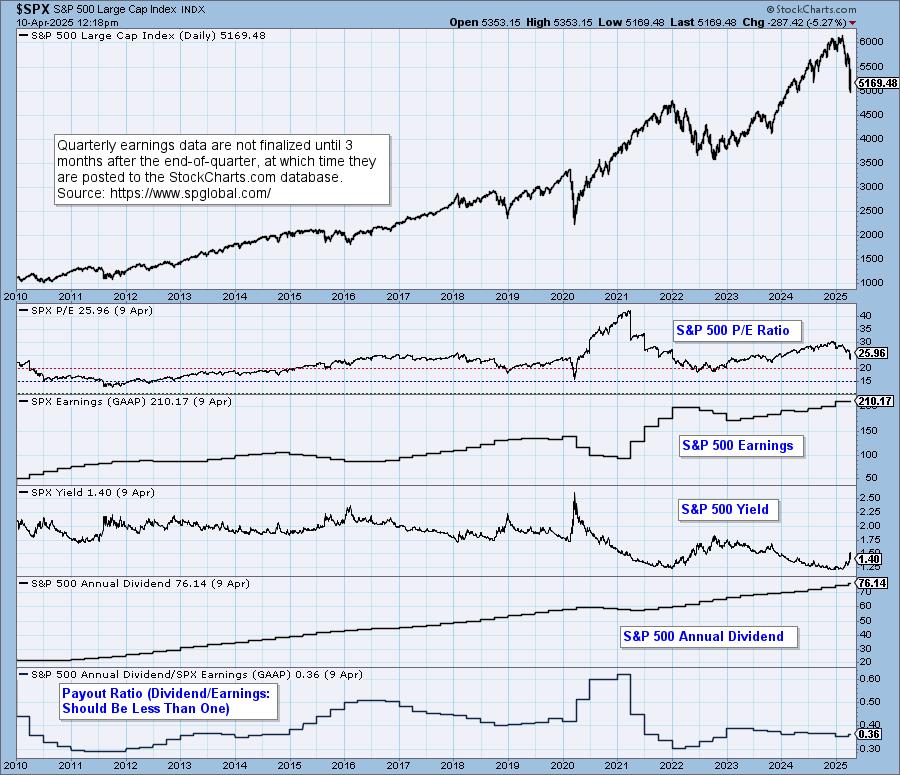
This DecisionPoint chart keeps track of S&P 500 fundamentals, P/E and yield, and it is updated daily — not that you need to watch it that closely, but it is up-to-date when you need it.
CONCLUSION: The market is still very overvalued and the P/E is still well above the normal range. Earnings have ticked up and are projected to trend higher for the next four quarters. High valuation applies negative pressure on the market, but other more positive factors can keep the market in overvalued territory. The current bear market has brought the market to a less overvalued status, but there is still a long way to go to more normal valuation.
Watch the latest episode of DecisionPoint on StockCharts TV’s YouTube channel here!
(c) Copyright 2025 DecisionPoint.com
Technical Analysis is a windsock, not a crystal ball.
Disclaimer: This blog is for educational purposes only and should not be construed as financial advice. The ideas and strategies should never be used without first assessing your own personal and financial situation, or without consulting a financial professional. Any opinions expressed herein are solely those of the author, and do not in any way represent the views or opinions of any other person or entity.
DecisionPoint is not a registered investment advisor. Investment and trading decisions are solely your responsibility. DecisionPoint newsletters, blogs or website materials should NOT be interpreted as a recommendation or solicitation to buy or sell any security or to take any specific action.
Helpful DecisionPoint Links:
DecisionPoint Alert Chart List
DecisionPoint Golden Cross/Silver Cross Index Chart List
DecisionPoint Sector Chart List
Price Momentum Oscillator (PMO)