


Shiba Inu price remains under pressure this week, as the recent rebound faced substantial resistance at $0.00001520. While the coin’s outlook is neutral for now, an analyst has identified a harmonic chart pattern that points to an eventual rebound, potentially to its 2024 high of $0.000033. Such a move would signal be a 147% surge from today’s level.
SHIB price today trades at $0.00001345 and is experiencing subdued demand as its 24-hour volume was just $152 million. In contrast, smaller meme coins like Pepe, Official Trump, Bonk, and Fartcoin had a higher volume.
Analyst Sees an Eventual Shiba Inu Price Surge, Citing the XABCD Pattern
Waheed Ahmed, an anonymous crypto analyst, expects the Shiba Inu price to stage a strong comeback this year, eventually. He argues that it has formed the harmonic XABCD pattern, which could trigger a strong surge later this year.
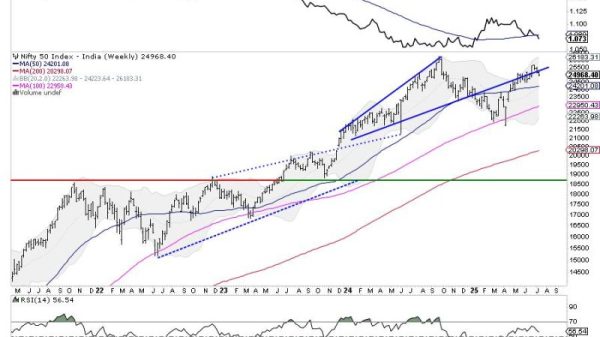
The chart below replicates Ahmed’s SHIB prediction. This chart shows that the SHIB price was in a slow uptrend between January 2023 and February 2024. It then went parabolic and hit a high of $0.00004540. This price forms the X and the starting point of the pattern.

It then dropped to $0.000011 in August 2024, a level that formed the A part of the section. B is the highest swing in 2024, while C is the year-to-date low. Therefore, if the pattern works well, it means that the Shiba Inu price will eventually rise and retest the highest point in 2024 at $0.00003345.
The caveat of this SHIB price forecast is that it is based on the weekly chart, where each bar represents a week. As such, it means that the timeline for the coin to get to the 2024 high may be long. For example, moving from B to C has taken over four months. As such, moving from C to D may take a few months.
A likely scenario is where it happens in the fourth quarter, which is usually a good period for Ethereum and tokens in its ecosystem, as the chart below shows.

The other caveat is that a drop below $0.000011 will invalidate the harmonic pattern, and risk it dropping to the 2023 low of $0.0000055, down by 60% from the current level.
SHIB Price Forecast: Short-Term Targets
The long-term Shiba Inu forecast is bullish based on the abovementioned harmonic pattern. However, the four-hour chart points to short-term volatility and potential retreat.
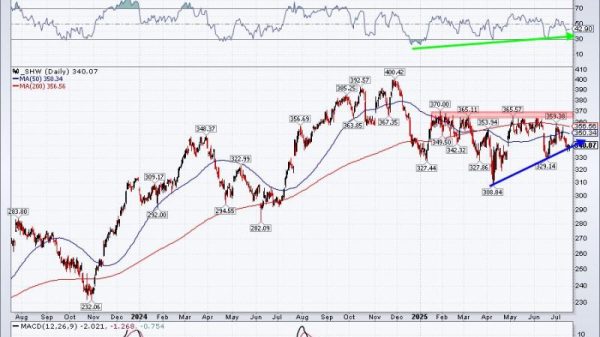
This chart shows that it has formed a head and shoulders pattern. The head is at last month’s high of $0.00001523, while the two shoulders are at $0.00001390, and the neckline is at $0.00001285. A move above the shoulders and the head will cancel the bearish Shiba Inu price forecast.

This pattern often leads to a strong bearish breakout, which in this case, will be confirmed if it drops below the neckline. By measuring the distance from the head to the neckline and the same one from the neckline, it shows the most likely short-term SHIB forecast at $0.000010, down by 20% below the current level.
The post Analyst Provides Timeline For Shiba Inu Price to Reach 2024 Highs appeared first on CoinGape.