


The cryptocurrency market witnessed low volatility on Saturday’s trading session as Bitcoin price stabilized above $65000. Along with most major altcoins, the Solana price traded sideways and showed a modest dip of 0.37% to $157. This consolidation could provide a cool-off for buyers after a three-week rally.
Solana Price Chart Pattern Signals a Potential Surge to $400
In a recent tweet, crypto influencer Cold Blooded Shiller teased a bold forecast for three major cryptocurrencies. He predicted the Bitcoin (BTC) price would reach $110,000, the Ethereum (ETH) would hit $6,000, and the Solana (SOL) price to $370.
While keeping the details for a later thread, the renowned trader has shared his super optimistic outlook for these cryptocurrencies with his 293.3 followers on X (formerly known as Twitter).
$BTC $110,000$ETH $6,000$SOL $370
Warming up the thread for later.
— Cold Blooded Shiller (@ColdBloodShill) September 27, 2024
The recovery potential for the Solana coin is further backed by the steady rise in total volume lock (TVL), currently at $5.46 Billion as per DeFiLlama. The rising TVL indicates growing confidence in the network’s decentralized applications (dApps) and DeFi projects, attracting more users and capital.
SOL Price to End Seven-Month Consolidation
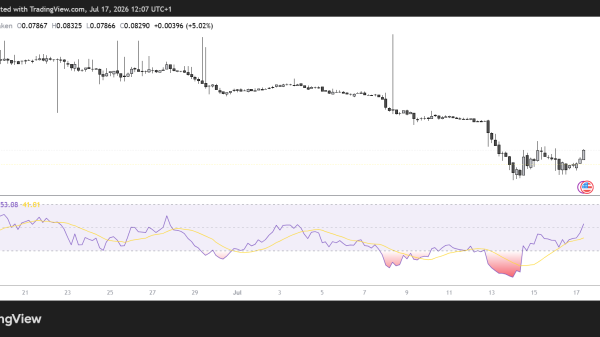
In the last five weeks, the Solana price prediction showcased a V-shaped recovery from $120 to $156.9, accounting for a 30.78% jump. The rising price managed to reclaim crucial daily exponential moving averages (20, 50, 100, and 200), highlighting a positive flip in investors’ sentiment.
With sustained buying, the SOL price would surge 15% before challenging the flag pattern resistance at $180. For the past seven months, the pattern’s two converging trendlines have driven a consolidation trend for buyers to recuperate the bullish momentum.
A potential breakout from the overhead trendline will chase an initial target of $280. However, the pattern suggests an extended target range of $380 to $400, calculated by projecting the pole length from the potential breakout point.
SOL/USDT – 1d Chart
On the contrary, if the Solana price reverts from the overhead trendline, the current consolidation would prolong.
The post This Solana Price Chart Pattern Forecasts SOL Could Hit $400 appeared first on CoinGape.