


BNB price has remained in a consolidation phase as the daily and weekly charts send mixed signals. Binance Coin, the fifth-biggest cryptocurrency, has remained between $665 and $600 in the past 9 days. So, does it have a path to rise to $1,200?
BNB Price Has Formed A Rising Wedge
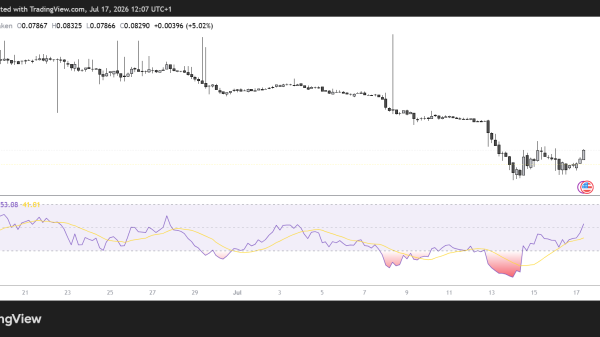
Binance Coin’s daily chart is sending a warning that the coin may soon have a steep bearish breakout.
It has been forming a rising wedge pattern since September. This pattern is formed when an asset’s higher highs and higher lows converge. In most periods, an asset often forms a bearish breakout when the two lines approach their convergence.
By measuring the distance between the widest part of the wedge, we can assume that the Binance Coin price may have a bearish breakout to $400, which is about 35% below the current level.
This BNB price forecast will be confirmed if the coin drops below the lower side of the wedge pattern at $580. On the flip side, a surge above the upper side of the wedge pattern at $665 will invalidate the bearish view and point to a jump to the year-to-date high of $721, 18% higher than the current level.
BNB Price Daily Chart
Binance Coin Is Forming A Bullish Pattern On The Weekly
On the positive side, as we have written before, BNB price has been forming a rare bullish pattern in the last three years.
The coin initially rose to a record high of $692.60 in 2021 and then pulled back. It then rose to $667.17 and then started its downward trend, bottoming at $188 in 2022. In all this time, the coin has been forming the rare cup and handle pattern whose upper side was between $700 and $667.
Assets tend to either consolidate or pull back after completing the formation of the cup section. This explains why the coin has remained in a tight range in the past few months.
Supporting this view is the fact that the coin has remained above the 50-week moving average and the coin formed a long-legged doji in August.
BNB Price Weekly Chart
Therefore, the path to $1,000 will become clearer when the Binance Coin price rallies above the year-to-date high of $721. The bullish view, on the other hand, will become invalid if the BNB token drops below the lower side of the doji at $402. Such a move will validate the rising wedge on the daily chart and point to more downside.
The post BNB Price Forms A Risky Pattern: Is There A Path To $1200? appeared first on CoinGape.